OYO Financials FY26: Revenue, Profit, Debt & Cash Flow Explained
Published: 10 min read
OYO’s consolidated FY26 results show higher revenue, a move from pre-tax loss to profit and stronger operating cash flow. Its ₹994.18 crore net profit includes a ₹595.25 crore net tax credit, while pre-tax profit also includes material other income. Cash generation improved after interest, lease payments and capital spending, although gross rupee borrowings increased between the March year ends.
This analysis covers Oravel Stays Limited, the company behind the OYO hospitality brand and associated with the PRISM umbrella identity. FY26 means the year ended 31 March 2026; comparisons are with FY25 on a consolidated basis. The main source is the company’s FY2025–26 annual report. Developments discussed below have a research cutoff of 22 October 2026.
For the company hub and transaction context, see OYO company and unlisted-share details.
For broader information about investing in unlisted shares, explore Unlisted Valley.
Key takeaways:
- G6’s full-year contribution affects the growth comparison; booking value and recognised revenue measure different things.
- Tax credits explain a substantial part of net profit in both years. FY26 also improved before tax.
- Operating cash flow precedes several interest and lease payments in these accounts. Deducting them and specified capital spending gives a more useful view of the remaining cash.
OYO FY26 results compared with FY25
Operating revenue grew 49.66% in FY26, and the group earned a pre-tax profit after recording a pre-tax loss in FY25. These changes show improvement before the effect of income-tax credits.
All amounts below are ₹ crore.
Measure | FY25 | FY26 |
Revenue from operations | 6,252.83 | 9,357.98 |
Board headline EBITDA — company-reported measure | 1,083.50 | 2,593.84 |
Profit/(loss) before tax | (489.32) | 398.93 |
Profit after tax (PAT) — total group | 244.82 | 994.18 |
Net cash from operating activities | 244.82 | 2,511.21 |
Source: Oravel Stays Limited Annual Report FY2025–26, audited consolidated statements for FY25/FY26 and the Board’s company-reported EBITDA table. Revenue growth is an Unlisted Valley calculation. EBITDA is explained separately below.
Revenue from operations is income recognised from the business. It excludes other income, such as certain investment or accounting gains. Adding other income gives total income, which is a different figure. Gross booking value, discussed next, measures booking activity rather than recognised revenue.
G6 changes the growth comparison
The annual report attributes G6’s much larger FY26 contribution to a full year of consolidation after its acquisition in FY25. G6 operates the Motel 6 and Studio 6 businesses in North America. Comparing the two years therefore includes a change in the period for which G6 contributed to group results.
The effect is visible in gross booking value, or GBV:
Gross booking value, ₹ crore | FY25 | FY26 |
Group total | 16,278.78 | 30,683.23 |
G6 | 3,529.08 | 14,107.13 |
Group excluding G6 | 12,749.70 | 16,576.09 |
Source: FY2025–26 annual report, Board operational table. GBV is a company-reported operating measure; the group-excluding-G6 totals and calculations below are Unlisted Valley calculations from unrounded inputs.
G6 accounted for approximately 73.44% of the absolute increase in group GBV. The rest of the group also grew: aggregate GBV excluding G6 increased 30.01%.
That 30.01% is not an organic revenue-growth rate. It does not remove other acquisition effects, currency changes or changes in the property base, and GBV itself is not revenue. In particular, ₹14,107.13 crore is G6’s FY26 GBV, not its recognised revenue.
The group’s geographical mix also matters. Approximately 83.92% of FY26 operating revenue came from outside India, based on the annual report’s geographical revenue disclosure. International travel demand and currencies therefore matter to the results; Indian travel activity alone cannot explain the group’s performance. The geographical figures do not establish profitability by country.
How tax credits and other income affected profit
A net tax credit contributed ₹595.25 crore to OYO’s ₹994.18 crore FY26 group profit. The group was profitable before tax, but the tax credit substantially increased the after-tax result.
The two-year bridge shows why FY25 needs the same scrutiny:
Profit bridge, ₹ crore | FY25 | FY26 |
Profit/(loss) before tax (PBT) | (489.32) | 398.93 |
Add deferred-tax credit | 767.56 | 677.64 |
Less current-tax expense677.64 | (33.42) | (82.39) |
Profit after tax — total group | 244.82 | 994.18 |
Net tax credit already included above | 734.14 | 595.25 |
Source: FY2025–26 annual report, audited consolidated profit-and-loss statement and tax note. The net-credit row explains the combined tax effect; it is not another amount to add. Figures are rounded independently.
The often-cited ₹677.64 crore and ₹595.25 crore FY26 tax figures describe different stages of the same calculation. The first is the deferred-tax credit. After ₹82.39 crore of current-tax expense, the net credit is ₹595.25 crore, calculated before rounding.
A deferred-tax credit is an accounting benefit related to future tax consequences. Recognition of a deferred-tax asset depends on its recoverability against expected future taxable profits. It does not mean the company received that amount in cash during FY26.
The net tax credit represented approximately 59.87% of FY26 PAT. Yet the comparison also shows improvement independent of that credit: pre-tax performance turned positive while the net tax credit was smaller than in FY25. FY25’s after-tax profit followed a pre-tax loss.
Pre-tax profit still requires context. FY26 other income of ₹339.94 crore included a ₹129.90 crore fair-value gain on loss of control in a subsidiary and an ₹81.55 crore net gain on lease modifications or terminations. These are material accounting gains within the reported earnings, as shown in the annual report’s other-income disclosure.
PBT helps separate the tax effect, but it should not automatically be read as recurring operating earnings. Likewise, subtracting selected tax credits or gains from PAT does not produce an official “normalised profit” figure. The useful conclusion is that pre-tax performance improved, with material other-income and tax effects still requiring attention.
What OYO’s reported EBITDA includes
OYO’s Board headline EBITDA was ₹2,593.84 crore in FY26. That measure uses adjustments beyond simply adding finance costs and depreciation back to pre-tax profit, which helps explain why different EBITDA figures can appear in financial summaries.
EBITDA means earnings before interest, tax, depreciation and amortisation. Depreciation and amortisation spread the cost of assets over their accounting lives. Company-defined EBITDA measures can also remove or add other items, so the definition matters alongside the number.
The following bridge reconstructs the Board headline from published inputs. Three decimal places are retained here so the arithmetic can be reproduced.
EBITDA bridge, ₹ crore | FY25 | FY26 |
PBT + finance cost + depreciation/amortisation | 953.425 | 1,083.499 |
Remove other income | (73.058) | (339.943) |
Remove share of joint-venture profit | (11.352) | (35.501) |
Add share-based payment expense | 47.469 | 84.213 |
Add exceptional expense | 167.015 | 0 |
Reconstructed Board headline EBITDA | 1,083.499 | 2,593.838 |
Source: FY2025–26 annual report, Board EBITDA table and audited consolidated earnings/expense inputs. This bridge is Unlisted Valley’s algebraic reconstruction, not a company-supplied reconciliation or a separate audit opinion on the KPI.
The reconstruction removes other income and joint-venture profit, then adds back share-based payment expense and the FY25 exceptional expense. The Board also presents a separately labelled FY26 EBITDA measure of ₹2,629.34 crore that includes joint-venture profit. It should not be substituted for the headline measure without changing the label.
Using the headline measure consistently, EBITDA rose 139.39%. As a share of operating revenue, it increased from 17.33% to 27.72%. These are Unlisted Valley calculations from the annual report; the denominator is revenue, not GBV.
EBITDA does not account for all cash payments. Interest, lease obligations and asset purchases are particularly relevant when moving from this earnings measure to cash generation.
Cash flow after interest, leases and capital spending
OYO generated ₹2,511.21 crore of operating cash in FY26. After deducting the cash interest, lease payments and capital spending specified below, the illustrative remainder was ₹408.47 crore, compared with negative ₹1,038.57 crore in FY25.
The deductions matter because these accounts classify borrowing interest, lease interest and lease principal under financing activities. They have not already been deducted from the operating-cash figure. Operating cash flow is after cash taxes, but it does not represent cash left after all financial obligations.
Cash bridge, ₹ crore | FY25 | FY26 |
Net cash from operating activities | 321.25 | 2,511.21 |
Less borrowing interest paid | (757.04) | (981.97) |
Less lease interest paid | (128.90) | (373.41) |
Less lease principal repayments | (320.52) | (570.07) |
Less property/equipment and construction-in-progress purchases, net | (56.14) | (37.64) |
Less intangible asset purchases | (97.23) | (139.67) |
Unlisted Valley illustrative cash remainder | (1,038.57) | 408.47 |
Source: FY2025–26 annual report, audited consolidated cash-flow statement. The remainder is an Unlisted Valley calculation using unrounded source inputs; displayed deductions may produce a ₹0.01 crore rounding difference.
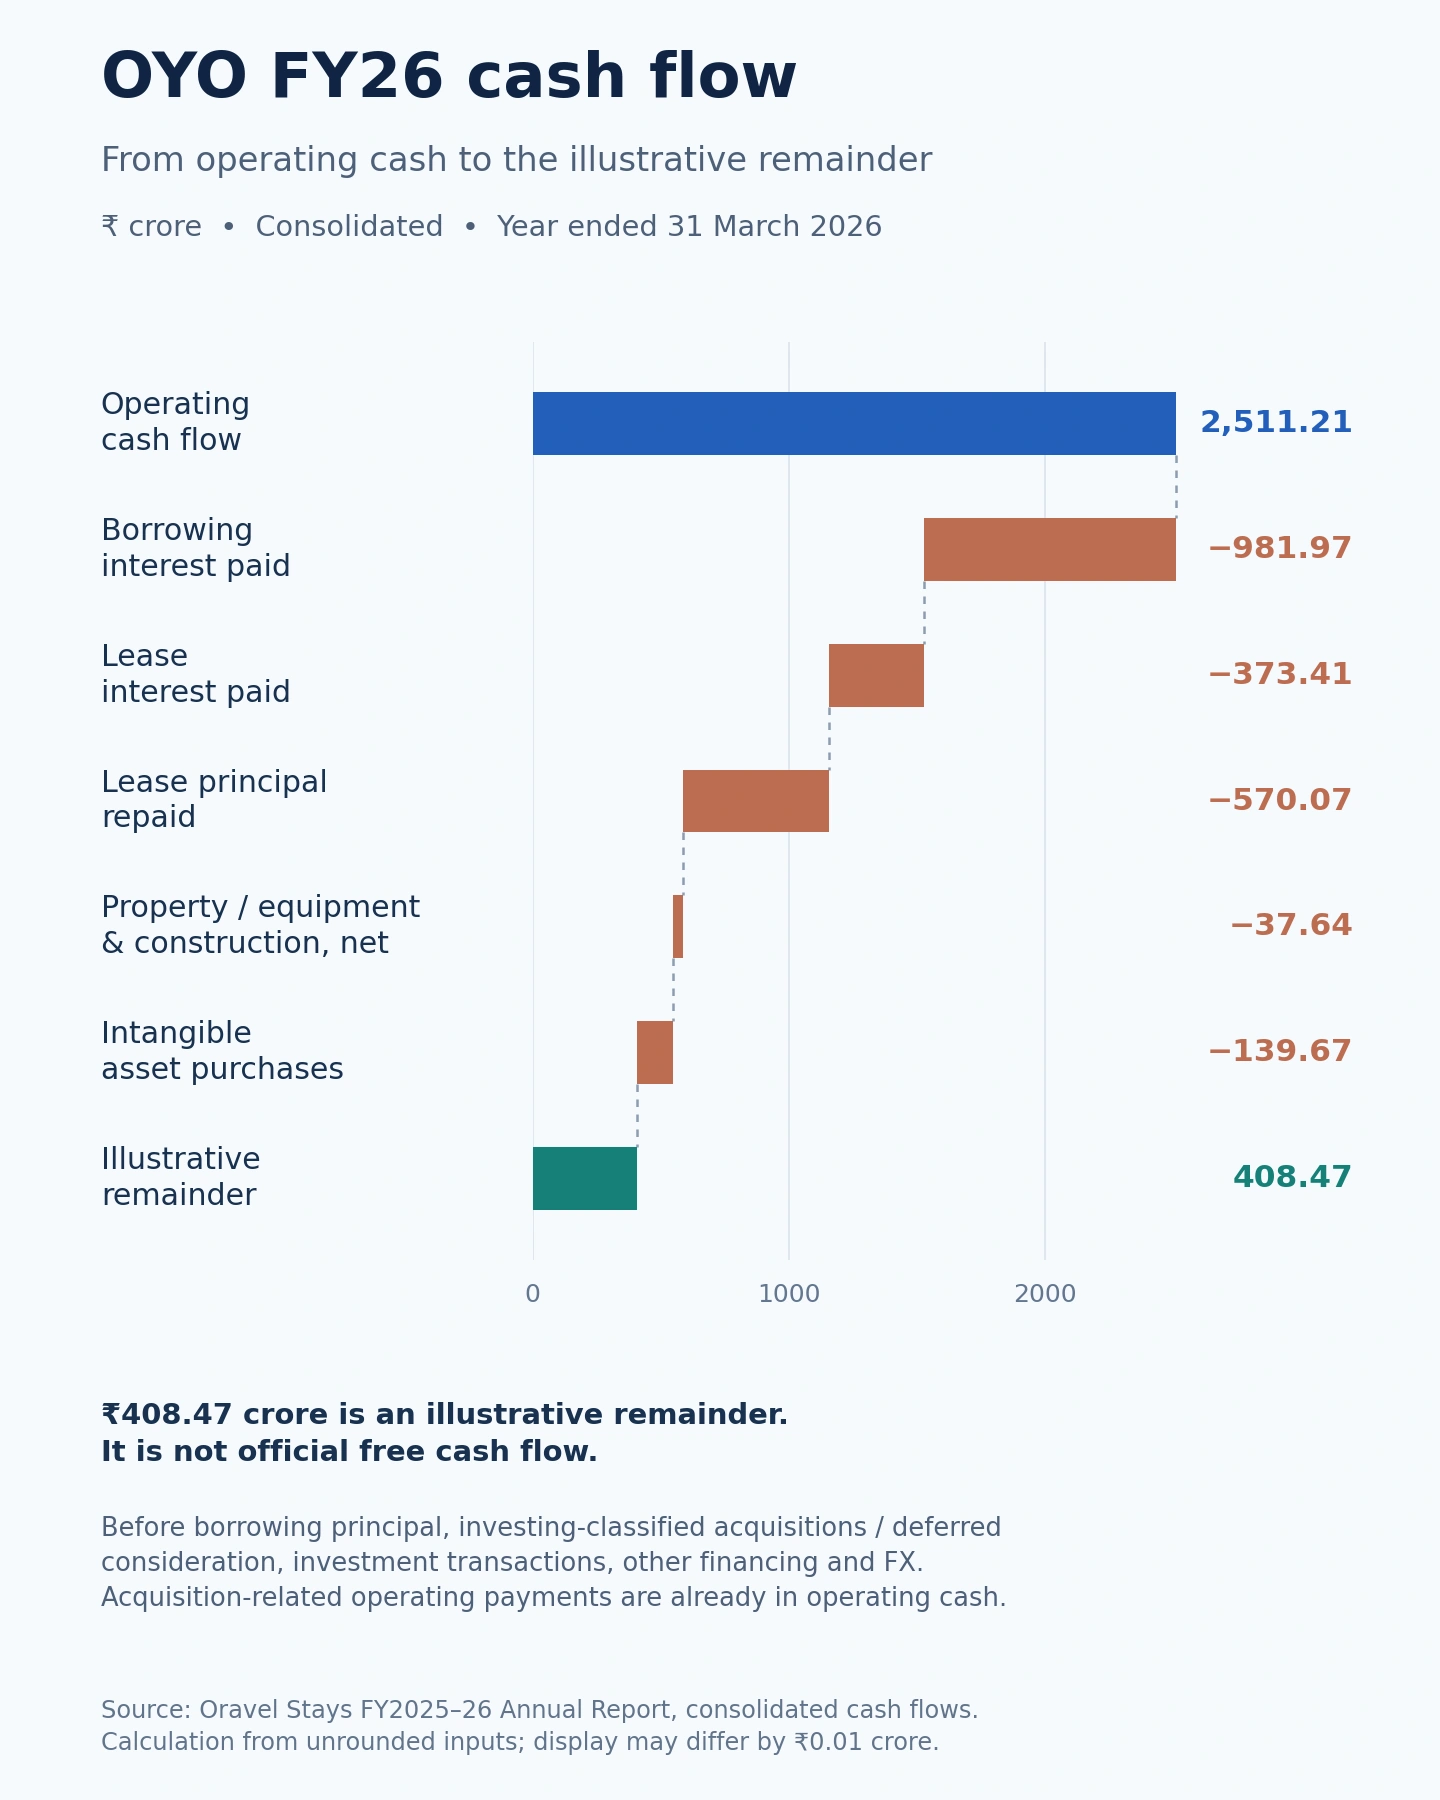
OYO FY26 consolidated cash bridge. Source: FY2025–26 annual report; Unlisted Valley calculation. The remainder is before borrowing principal, investing-classified acquisitions/deferred consideration, investment transactions, other financing and FX; acquisition-related operating payments already included in operating cash are not deducted again.
This remainder is before borrowing principal repayments, acquisitions or deferred consideration classified in investing activities, investment transactions, other financing items and foreign-exchange movements. It is not company-reported free cash flow, distributable cash or the total change in cash balances. Operating rents already included in operating cash flow are not deducted again.
On this defined comparison, cash generation after the specified outflows improved to positive. Whether it remains positive requires further periods of results; one year does not establish sustainable annual cash generation.
Working capital did not provide an aggregate FY26 cash boost. Movements in receivables, payables and other operating balances consumed ₹81.27 crore overall. Higher trade payables supplied cash, but other movements more than offset that benefit. The cash-flow statement therefore does not support attributing the operating-cash improvement solely to higher payables. Its working-capital note also identifies ₹113.82 crore paid against opening liabilities relating to an acquired business; that payment is already reflected in operating cash flow and has not been deducted again.
Finance expense and cash interest also differ. The ₹1,414.25 crore FY26 finance cost includes borrowing interest, lease interest and other financing costs on an accounting basis. Cash borrowing interest paid was ₹981.97 crore, with ₹373.41 crore of lease interest paid separately. Calling the entire finance cost “loan interest paid” would blur those distinctions.
Borrowings and the next financial checks
Gross borrowings excluding leases rose from ₹7,144.05 crore at 31 March 2025 to ₹7,809.56 crore at 31 March 2026. Positive cash progress therefore did not translate into a fall in absolute rupee borrowings between those dates.
Lease liabilities were separate: ₹2,712.48 crore at 31 March 2026, compared with ₹2,700.68 crore a year earlier. Balance-sheet cash and cash equivalents rose from ₹684.40 crore to ₹1,007.08 crore. These are historical March balances, not a statement of debt or liquidity in October. Source: FY2025–26 annual report, consolidated balance sheet.
Funding plans could change the debt position after year end. Reuters reported on 22 October 2026, citing a filing, that the proposed fresh IPO issue had been reduced to ₹3,350 crore. This is a reported fundraising proposal; future debt reduction depends on the proceeds actually raised and repayments completed. An exact current repayment allocation cannot be inferred from an older offer document.
For the earlier filing chronology, see OYO IPO status and filing updates. That article’s 2 October cutoff predates the reported issue-size revision above.
The next financial results will be most useful if they clarify four points:
- Whether growth continues on more comparable acquisition periods, with enough information to separate booking activity from recognised revenue.
- Whether positive pre-tax earnings persist and how much comes from operating performance versus other income.
- Whether cash remains positive after the interest, lease and capital-spending deductions shown above.
- Whether completed borrowing repayments reduce obligations, alongside continued support for deferred-tax asset recoverability.
Methodology and sources
Annual figures are consolidated and relate to the years ended 31 March 2025 and 31 March 2026. Source amounts in ₹ million are divided by 10 to express ₹ crore. Calculations use unrounded inputs; most displayed values are rounded to two decimals. PAT means total group profit after tax, rather than profit attributable only to parent shareholders.
The main numerical source is Oravel Stays Limited Annual Report FY2025–26, signed 31 July 2026: Board operating measures on PDF page 8; consolidated balance sheet, earnings and cash flows on pages 163–165; other income and financing costs on pages 216–217; tax on page 218; and geographical revenue on page 235. The consolidated financial statements are audited. Board EBITDA and GBV are company-reported measures; Unlisted Valley’s reconciliations and cash remainder are its own calculations, not separately audited KPIs. The October funding note is attributed to Reuters; the underlying revised filing was not independently inspected for this analysis.
Disclosure
Unlisted Valley facilitates transactions in OYO unlisted shares and has a commercial interest in this market. This article is for information only and is not an investment recommendation or a guarantee of returns, liquidity or an IPO.