NCDEX Financials FY26: Revenue, Loss, EPS & Analysis
Published: 13 min read

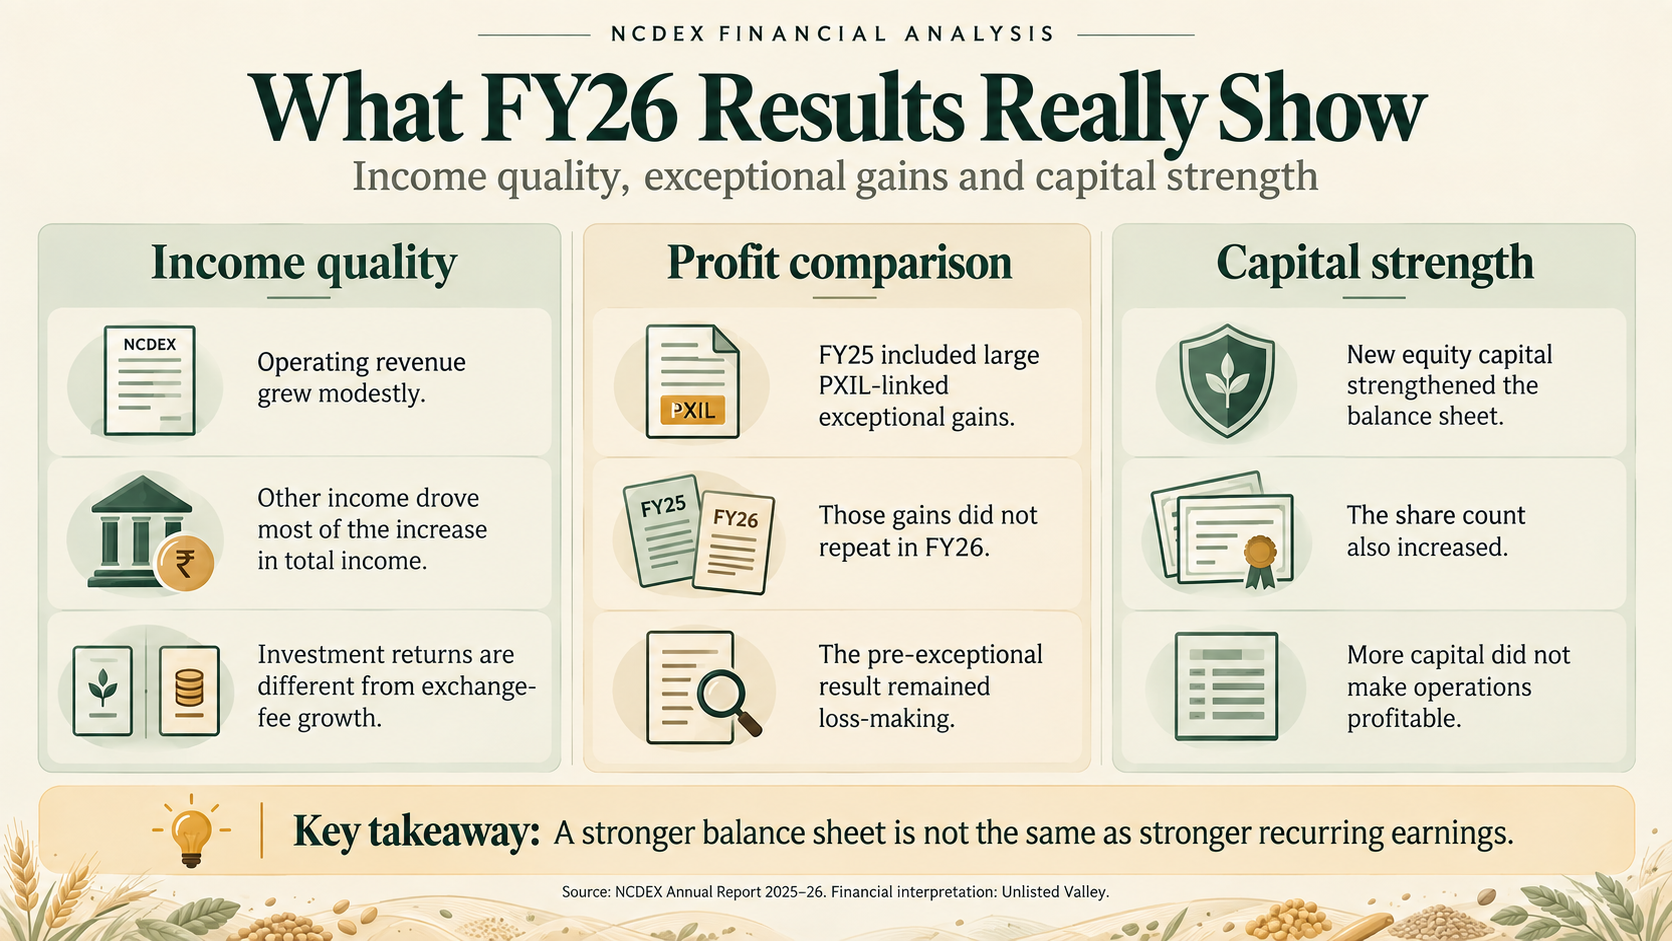
NCDEX Limited recorded an audited consolidated loss of ₹46.24 crore in FY26, even as total income rose 25.65% to ₹153.37 crore. The key distinction is that operating revenue grew only 2.55% to ₹90.44 crore, while most of the increase came from other income.
In fact, ₹29.06 crore of the ₹31.31 crore increase in total income came from other income—about 92.81% of the incremental increase. At the same time, FY25's ₹236.09 crore consolidated profit included ₹344 crore of exceptional income, largely linked to NCDEX's PXIL transaction. This makes a simple FY25-profit-versus-FY26-loss comparison misleading.
The cleaner reading is that NCDEX remained loss-making in FY26, but its result before joint-venture/associate profits, exceptional items and tax improved modestly. The balance sheet also became much stronger after a ₹770 crore equity raise, although that capital strength should not be confused with operating profitability.
NCDEX FY26 results at a glance
NCDEX's FY26 financials show modest operating growth, a much larger rise in other income and continued losses.
Metric | FY25 | FY26 |
Operating revenue | ₹88.19 cr | ₹90.44 cr |
Other income | ₹33.87 cr | ₹62.93 cr |
Total income | ₹122.06 cr | ₹153.37 cr |
Total expenses | ₹197.01 cr | ₹219.88 cr |
Result before JV/associate profits, exceptional items and tax | -₹74.95 cr | -₹66.51 cr |
Exceptional income/(expense) | ₹344.00 cr | -₹2.98 cr |
Profit/(loss) before tax | ₹278.82 cr | -₹63.99 cr |
Group PAT | ₹236.09 cr | -₹46.24 cr |
PAT attributable to NCDEX owners | ₹237.49 cr | -₹44.16 cr |
Reported consolidated EPS | ₹46.86 | -₹6.36 |
PAT means profit after tax; PBT means profit before tax. Figures are consolidated and audited. Source: NCDEX Annual Report 2025–26, audited consolidated financial statements.
The ₹46.24 crore group loss is different from the ₹44.16 crore loss attributable to NCDEX's owners. The latter is the relevant earnings base for consolidated EPS. On a standalone parent-company basis, NCDEX reported a FY26 loss of ₹41.22 crore.
The five-year view also shows why FY25 needs to be treated carefully:
Financial year | Operating revenue | Group PAT |
FY22 | ₹115.33 cr | -₹12.26 cr |
FY23 | ₹103.93 cr | -₹42.37 cr |
FY24 | ₹96.40 cr | -₹27.70 cr |
FY25 | ₹88.19 cr | ₹236.09 cr* |
FY26 | ₹90.44 cr | -₹46.24 cr |
FY25 included ₹344 crore of exceptional income. Historical figures are consolidated and audited. FY24 uses the later comparative presentation in the FY2024–25 annual report, so this table should not be read as a constant-perimeter organic-growth series. Sources: NCDEX Annual Report 2022–23, NCDEX Annual Report FY2024–25 and NCDEX Annual Report 2025–26.
Why FY25 profit became an FY26 loss
The biggest reason is simple: FY25 contained a large exceptional gain that did not repeat in FY26.
NCDEX reported ₹344 crore of exceptional income separately in FY25, made up principally of:
- ₹139.37 crore profit from the PXIL stake sale;
- ₹218.99 crore gain from remeasuring the retained PXIL interest; and
- a ₹14.36 crore provision against a doubtful receivable, which reduced the net exceptional gain.
A remeasurement gain is an accounting gain created when a retained investment is revalued after the nature of the investment changes. It is therefore different from cash received through the stake sale itself.
FY26, by comparison, had an exceptional expense of ₹2.98 crore. The annual report identifies this as a labour-code-related charge.
The pre-tax bridge makes the change clearer:
FY25 to FY26 PBT bridge | Impact |
FY25 PBT | ₹278.82 cr |
Improvement in result before JV/associate profits, exceptional items and tax | +₹8.44 cr |
Change in exceptional items | -₹346.98 cr |
Change in JV/associate profit share | -₹4.27 cr |
FY26 PBT | -₹63.99 cr |
Unlisted Valley calculation from the audited consolidated statements. Source: NCDEX Annual Report 2025–26. This is a pre-tax bridge, not an adjusted PAT calculation.
The important point is that the ordinary-income-and-expense subtotal was loss-making in both years. It improved from -₹74.95 crore to -₹66.51 crore, but that was nowhere near enough to offset the disappearance of FY25's exceptional gains.
So FY26 was weaker on the reported bottom line, but the headline swing from ₹236.09 crore profit to ₹46.24 crore loss overstates the deterioration in the underlying pre-exceptional result.
What drove the increase in other income?
Other income, rather than operating revenue, drove most of NCDEX's FY26 income growth.
Other income increased from ₹33.87 crore to ₹62.93 crore, a rise of ₹29.06 crore. That represented 92.81% of the total ₹31.31 crore increase in total income.
The annual report shows several contributors within other income, including:
- bank-deposit interest of ₹29.64 crore, versus ₹23.46 crore in FY25;
- mutual-fund sale and fair-value gains of ₹18.29 crore, versus ₹4.48 crore; and
- ₹4.00 crore of interest from amortised-cost bonds in FY26.
At the standalone parent-company level, investment income increased to ₹32.35 crore from ₹9.53 crore. Management attributed that increase primarily to returns earned on temporarily invested, unused proceeds from the preferential issue.
That explanation should not be stretched to every group-level other-income line, but it matters for investors: part of the FY26 income improvement came from returns on a larger capital base rather than from a comparable rise in exchange operating revenue.
Source: NCDEX Annual Report 2025–26, note 21 and management discussion and analysis.
Did trading recovery improve the operating business?
Trading activity improved in FY26, but the available financial evidence does not show a turnaround in exchange profitability.
NCDEX reported average daily traded value (ADTV) of ₹709 crore, up from ₹599 crore in FY25—an increase of about 18.36%. However, standalone transaction charges increased only 3.44%, from ₹15.98 crore to ₹16.53 crore.
The reviewed filings do not establish the exact reason transaction-fee growth lagged traded-value growth. Product mix, trading days, fee structures or other factors could matter, but attributing the gap to any one of them without evidence would be speculation.
Costs also remained high. Consolidated total expenses increased from ₹197.01 crore to ₹219.88 crore, while employee costs rose from ₹95.93 crore to ₹109.42 crore. Management linked higher parent-company personnel costs to strategic hiring for the planned equity expansion and salary benchmarking, but that does not mean every increase in group expenses was expansion-related.
Segment reporting shows the challenge more clearly:
Segment result | FY25 | FY26 |
Commodity exchange | -₹69.17 cr | -₹69.39 cr |
E-market segment | ₹8.28 cr | ₹8.85 cr |
Source: NCDEX Annual Report 2025–26, segment note 35.
The commodity-exchange segment therefore remained deeply loss-making despite the recovery in traded value, while the e-market segment stayed profitable.
There was also an important regulatory constraint in the background. NCDEX disclosed that the suspension of specified commodity contracts had been extended to 31 March 2027. This should not be read as a suspension of the entire exchange, and the available filings do not quantify how much of FY26's financial performance was caused by that restriction.
What the capital raise changed for shareholders
The ₹770 crore preferential issue materially strengthened NCDEX's balance sheet, but it also increased the share count and did not by itself make the business profitable.
On 7 October 2025, NCDEX allotted 39,018,973 new shares at ₹197.34 each, raising ₹770 crore gross. That ₹197.34 figure is the historical issue price for the preferential allotment, not a current unlisted-share quote. The allotted shares were subject to a 12-month lock-in from allotment.
Net issue proceeds were ₹761.83 crore. By 31 March 2026, NCDEX had used ₹14.67 crore, leaving ₹747.16 crore unutilised and temporarily invested. By 30 June 2026, disclosed utilisation had increased to ₹59.52 crore, with ₹702.31 crore remaining unused.
The capital raise changed the per-share picture as well:
Measure | FY25 | FY26 |
Closing shares outstanding | 5.0676 cr | 8.9695 cr |
Owners' equity | ₹727.89 cr | ₹1,486.92 cr |
Calculated owners' book value/share | ₹143.64 | ₹165.78 |
Book value per share is calculated as equity attributable to NCDEX owners divided by closing shares outstanding. It excludes non-controlling interests. Source: NCDEX Annual Report 2025–26.
Closing shares increased by roughly 77% over the year. That is not the same as saying every existing shareholder experienced exactly 77% ownership dilution; dilution depends on the holder's position and participation.
The rise in book value also needs context. Owners' equity increased despite the annual loss because the company raised substantial new equity capital. A higher book value per share is therefore not evidence that retained operating profits drove the balance-sheet improvement, nor should book value be treated as a guaranteed floor for the unlisted share price.
Why reported EPS is -₹6.36, not a simple year-end share calculation
NCDEX's audited consolidated EPS for FY26 was -₹6.36. EPS uses earnings attributable to owners and a weighted-average share count, not just the number of shares outstanding on 31 March.
For FY26, the weighted-average share count was 69,490,628 shares. Dividing year-end group PAT by the closing share count produces a different number and should not be used to replace the audited EPS.
Higher cash did not mean positive operating cash flow
NCDEX's consolidated cash equivalents rose from ₹162.35 crore to ₹204.56 crore, but operating cash flow was still -₹133.70 crore.
The cash-flow statement shows:
- operating cash flow: -₹133.70 crore;
- investing cash flow: -₹579.78 crore; and
- financing cash flow: +₹755.69 crore.
Together, these produced a ₹42.21 crore increase in closing cash. The higher year-end cash balance therefore reflects financing and investment movements as well as operations, with the equity raise playing a major role.
Group operating cash flow also includes movements related to clearing and member balances, so it should not be treated mechanically as the exchange's standalone annual cash burn. Standalone operating cash flow was -₹72.85 crore in FY26.
Source: NCDEX Annual Report 2025–26, consolidated cash-flow statement and notes 12, 28 and 61.
Q1 FY27 results and subsequent business milestones
Q1 FY27 showed a narrower group loss, but the follow-up evidence was still mixed.
NCDEX's results for the quarter ended 30 June 2026 were unaudited and subject to limited review.
Consolidated metric | Q1 FY26 | Q4 FY26 | Q1 FY27 |
Operating revenue | ₹19.39 cr | ₹26.09 cr | ₹26.13 cr |
Group PAT | -₹13.79 cr | -₹9.80 cr | -₹8.30 cr |
Q4 FY26 is the balancing quarter. Source: NCDEX results for the quarter ended 30 June 2026, dated 6 August 2026.
Operating revenue was almost unchanged from Q4 FY26 but up 34.76% year on year. The group loss narrowed from ₹13.79 crore in Q1 FY26 and ₹9.80 crore in Q4 FY26 to ₹8.30 crore.
However, the commodity-exchange segment loss increased to ₹17.90 crore from ₹16.35 crore in Q4 FY26. That makes the quarter more useful as a mixed progress check than as evidence of a completed operating turnaround.
Several business milestones also occurred after FY26 ended:
- the company changed its name from National Commodity & Derivatives Exchange Limited to NCDEX Limited, effective 28 July 2026; and
- the Nidhi mutual-fund platform received final approval on 20 July 2026 and launched on 29 July 2026.
Because Nidhi launched after the end of FY26, it cannot explain FY26 revenue or profit. The reviewed evidence also does not establish quantified Nidhi adoption, revenue or profitability at this stage. Nidhi's confirmed mutual-fund-platform launch is separate from cash-equity and equity-derivatives trading and does not establish that either equity segment launched. NCDEX's Q1 FY27 results, notes 17–19, record these distinctions.
A completed NCDEX cash-equity or equity-derivatives launch was not verified in the sources reviewed to 2 October 2026. NCDEX disclosed conditional in-principle SEBI approval dated 29 July 2025 in its FY2024–25 Annual Report, Directors' Report. That historical approval established a development milestone; it did not establish that either segment had begun trading.
On 10 February 2026, Reuters reported, citing regulatory sources, that derivatives entry had been paused until cash-market participation, liquidity and price discovery were established. One source described at least six months between the cash and derivatives launches; technology upgrades were also reported. SEBI and NCDEX did not comment. The reviewed evidence does not establish whether that reported condition was subsequently withdrawn or precisely how it applies today.
NCDEX subsequently announced a TCS technology partnership on 13 February 2026. Its FY26 annual report, Directors' Report, PDF page 17, records SEBI approval of a Memorandum of Association amendment on 17 April 2026, effective 30 May 2026. A separate 28 July 2026 legal circular records approval of Rules/Bye-laws amendments on 22 June 2026, with Gazette publication still underway when the circular was issued. These developments show progress in preparation and governing documents; they do not establish final permission to commence either trading segment.
NCDEX's 17 June 2026 postal-ballot notice set out an announced roadmap for cash equities in FY2026–27 and equity derivatives in FY2027–28. Business Standard's 29 July 2026 report subsequently put the cash-equity target at January 2027, subject to SEBI approval, and the derivatives target at July 2027, also subject to approvals. Moneycontrol's report on the same date attributed the January cash-launch plan to managing director Arun Raste, with derivatives to follow. January 2027 remains the latest specific cash target located; it is a reported target, not a confirmed launch date or guidance independently reaffirmed in October.
For the financial outlook, investors still need evidence of separate trading commencement, customer participation and fee income before treating the planned equity businesses as an earnings contribution.
What investors should watch next
The main question after FY26 is not whether NCDEX has more capital—it clearly does. It is whether that capital and the new business initiatives can translate into stronger recurring operating economics.
The most useful indicators to track are:
- transaction-fee growth versus traded-value growth: higher activity matters more if it converts into operating revenue;
- commodity-exchange segment losses: FY26 turnover recovery did not materially reduce this segment's loss;
- expense trajectory: especially employee and technology costs as expansion continues;
- operating cash flow: to distinguish accounting income and investment returns from cash generated by the business;
- capital deployment: only ₹14.67 crore of net issue proceeds had been used by 31 March 2026, rising to ₹59.52 crore by 30 June; and
- evidence from new businesses: track Nidhi adoption, revenue and segment economics. For the equity expansion, watch for final regulatory permissions and separate cash-equity and equity-derivatives commencement records, followed by participation, trading fees and the cost of operating the new segments.
For valuation, FY26's negative earnings mean a conventional positive P/E multiple is not meaningful. FY25 is also a poor recurring-earnings base because of the ₹344 crore exceptional gain. Book value can provide balance-sheet context, but it does not capture the quality of earnings, deployability of assets or execution risk.
NCDEX also did not recommend a dividend for FY26.
For current unlisted-share pricing, availability and transaction information, see Unlisted Valley's NCDEX unlisted-share information.
Sources
- NCDEX Annual Report 2025–26 — audited FY26 financial statements and notes.
- NCDEX results for the quarter ended 30 June 2026, dated 6 August 2026 — official Q1 FY27 results, issue-proceeds utilisation and subsequent events.
- NCDEX Annual Report FY2024–25 — historical FY24/FY25 comparatives.
- NCDEX Annual Report 2022–23 — historical FY22/FY23 financials.
- Moneycontrol, 29 July 2026 — management's reported January 2027 cash-equity target, with derivatives to follow.
- Reuters, 10 February 2026 — reported derivatives-entry conditions attributed to regulatory sources.
- NCDEX–TCS press release, 13 February 2026 — technology-partnership announcement for the planned equity expansion.
- NCDEX postal-ballot notice, 17 June 2026 — announced FY27 cash-equity and FY28 equity-derivatives roadmap.
- NCDEX/Legal/02/2026, 28 July 2026 — 22 June Rules/Bye-laws approval and Gazette-publication status at the circular date.
- Business Standard, 29 July 2026 — reported January 2027 cash-equity and July 2027 derivatives targets, subject to approvals.
Disclosure
Unlisted Valley facilitates transactions in unlisted shares and may have a commercial interest in enquiries or transactions relating to NCDEX shares. This article is for information and financial interpretation only and should not be treated as investment advice or a recommendation to buy or sell securities. Unlisted-share prices, liquidity, regulations and company circumstances can change.