MSEI FY26 Results Explained: Revenue, Losses and Capital Raised
Published: 9 min read

MSEI’s FY26 consolidated net loss narrowed to ₹25.84 crore, but the improvement came from higher other income while revenue from operations declined. A ₹1,000 crore equity placement also enlarged its capital base. The financial results therefore show more funding and a smaller annual loss, without demonstrating growth in the exchange’s operating revenue.
The following June quarter needs to be read alongside that annual improvement: MSEI’s Q1 FY27 loss widened year on year. The annual and quarterly comparisons are set out separately below.
Source basis: MSEI’s audited consolidated FY26 results, dated 15 May 2026, accessed through a third-party mirror, and its unaudited consolidated June 2026 results, dated 29 July 2026, inspected from the original company document supplied for review. The June document’s public link could not be accessed on 16 October 2026; see Sources.
Metropolitan Stock Exchange of India Limited, also called MSE or MSEI, operates a securities exchange. Its company accounts measure income, expenses and financial resources; they do not measure the investment returns of securities traded on the exchange.
Key takeaways
- Separate revenue from operations from other income when judging progress in the exchange business.
- New shareholder funding explains the increase in equity; it should not be treated as profit earned.
- Cash flow and the composition of financial assets matter alongside the reported loss.
MSEI FY26 financial results at a glance
FY26 covers 1 April 2025 to 31 March 2026. The table uses audited consolidated figures, including subsidiaries, rather than standalone company figures.
Particulars, ₹ crore | FY25 | FY26 |
Revenue from operations | 4.31 | 3.38 |
Other income | 13.07 | 55.69 |
Total income | 17.38 | 59.07 |
Total expenses | 52.23 | 84.91 |
Net loss after tax | (34.22) | (25.84) |
Source: MSEI, FY26 audited consolidated financial results. Figures converted from ₹ lakh to ₹ crore; brackets indicate losses.
Total income grew approximately 239.9%, while revenue from operations fell 21.6%. Those measures answer different questions. Total income includes other income, so its growth does not establish that the exchange generated more operating revenue.
What contributed to other income?
Other income accounted for approximately 94.3% of FY26 total income. The cash-flow reconciliation identifies ₹40.14 crore of interest income from financial assets, together with fair-value gains and gains on investment sales.
Interest can provide income from financial resources. A fair-value gain, however, reflects a change in an asset’s measured value and need not represent cash received during the period. These components should not all be described as trading revenue or as cash generated by exchange operations.
Source: MSEI’s FY26 results and cash-flow statement; income-share and growth percentages calculated from the reported figures.
Why MSEI’s annual loss narrowed despite higher expenses
The increase in other income more than offset the combined effect of lower operating revenue and higher expenses. The following calculation reconciles the movement in the net result.
Movement from FY25 to FY26 | Effect on net result, ₹ crore |
FY25 net result | (34.22) |
Increase in other income | +42.62 |
Decline in revenue from operations | −0.93 |
Increase in total expenses | −32.68 |
Absence of FY25’s earlier-year tax benefit | −0.63 |
FY26 net result | (25.84) |
Source: Unlisted Valley calculation using MSEI’s audited consolidated FY26 and FY25 comparative figures. Parentheses denote a loss; positive movements improve the result and negative movements reduce it.
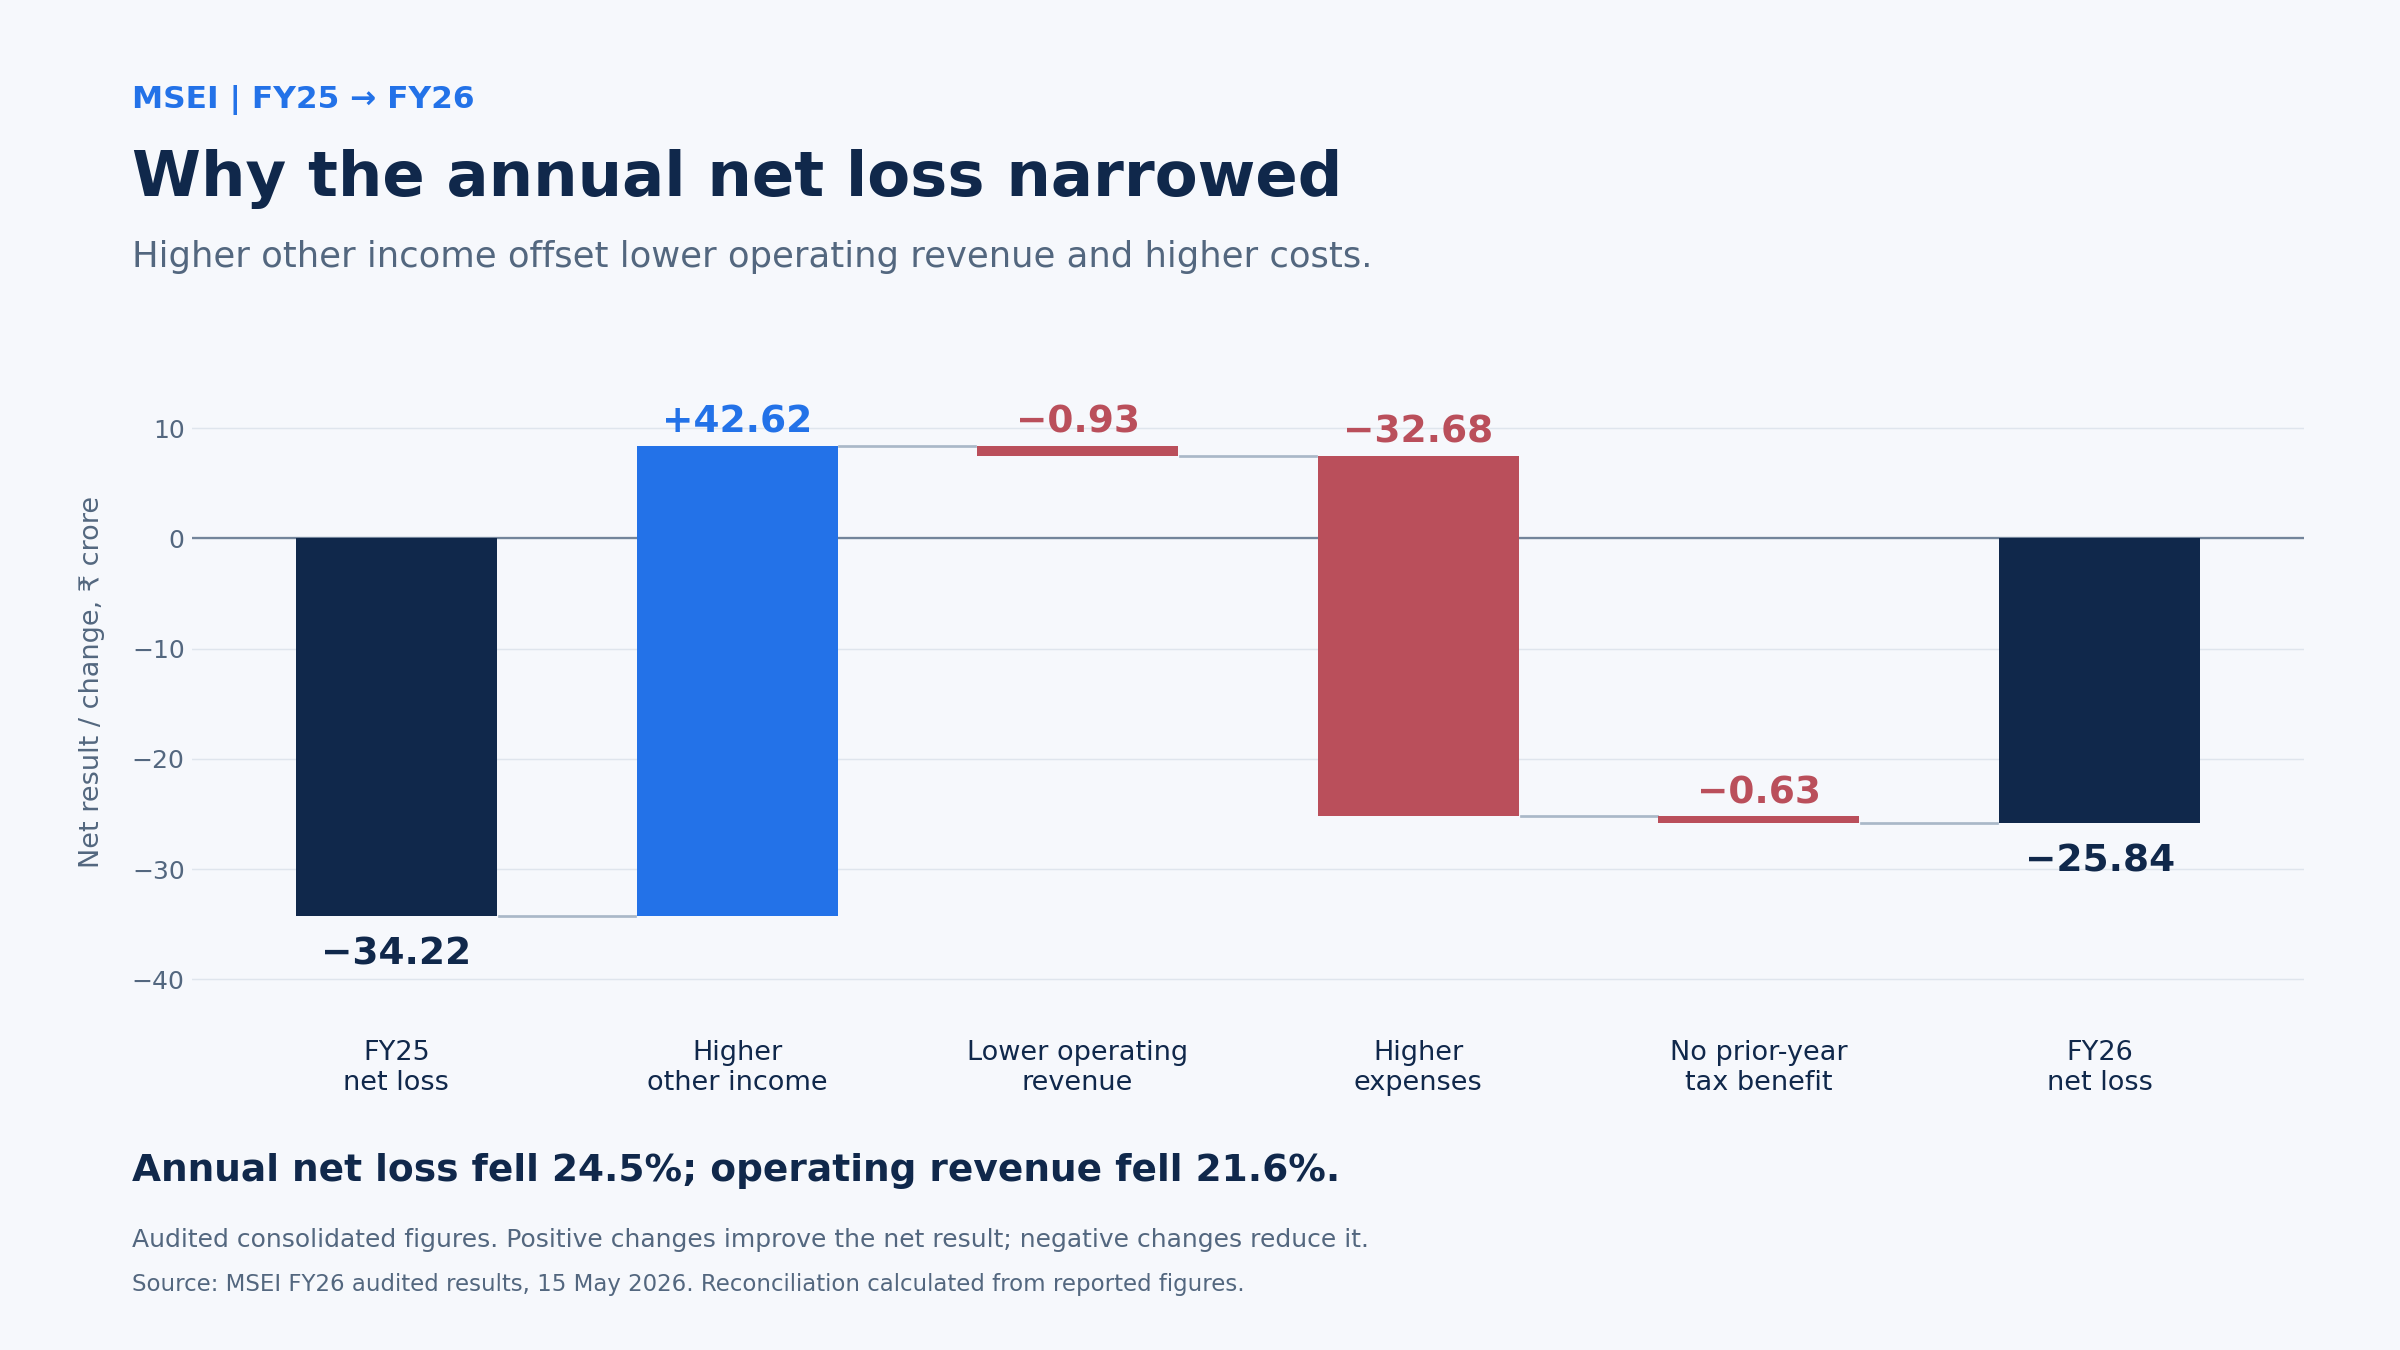
FY25-to-FY26 net-result bridge, audited consolidated basis, ₹ crore. Source: MSEI FY26 audited results; calculation by Unlisted Valley. Positive movements improve the result; negative movements reduce it.
The annual net loss reduced by approximately 24.5%. This calculation explains the accounting movement without attributing the improvement to greater exchange activity.
The expense base also changed materially. Employee benefits increased from ₹15.38 crore to ₹25.32 crore, other operating expenses from ₹4.92 crore to ₹14.23 crore, and depreciation and amortisation from ₹5.10 crore to ₹12.56 crore. Depreciation and amortisation allocate the cost of assets over their useful lives; they are not the same as cash paid to acquire assets during that year.
These increases help explain why the larger income figure did not produce a profit. They do not, on their own, establish whether the spending will generate enough future revenue.
Source: MSEI’s FY26 audited consolidated results.
How much capital did MSEI raise in FY26?
MSEI’s August 2025 placement raised ₹1,000 crore within FY26. The frequently referenced ₹1,238 crore total combines that placement with an earlier ₹238 crore issue in January 2025, which fell in FY25.
Placement period | Financial year | Shares issued | Issue price | Gross proceeds |
January 2025 | FY25 | 119 crore | ₹2 | ₹238 crore |
August 2025 | FY26 | 500 crore | ₹2 | ₹1,000 crore |
Source: Completed private placements disclosed in MSEI’s FY26 audited results. These are historical issue terms, not current unlisted-share quotes.
A private placement brings subscription money from investors into the company in exchange for shares. It increases funding and the share count; it is not business income. An existing holder who does not receive additional shares can consequently own a smaller percentage of the company.
Why total equity increased
Total equity—the accounting value of assets after deducting liabilities—increased from ₹396.69 crore at 31 March 2025 to ₹1,369.29 crore at 31 March 2026. Total assets increased from ₹443.86 crore to ₹1,434.48 crore over the same dates.
The movement reconciles approximately as follows, using ₹ crore:
396.69 opening equity + 1,000.00 new capital − 2.03 issue-related stamp duty − 25.37 total comprehensive loss = 1,369.29 closing equity.
Total comprehensive loss includes the net loss and adjustments recorded in other comprehensive income, such as employee-benefit remeasurements. The calculation shows why the new equity funding did not translate rupee for rupee into the closing equity balance.
The company also disclosed that issue-related stamp duty had initially been charged to expenses and was subsequently reclassified to securities premium, the equity account that records amounts received above a share’s face value. The reclassification did not itself change total equity or cash flow.
Source: MSEI’s FY26 balance sheet, comprehensive-income statement and accounting notes. Equity reconciliation calculated from the reported figures, rounded to ₹ crore.
What the cash-flow statement adds
MSEI used ₹149.01 crore in operating activities during FY26, compared with ₹68.44 crore in FY25. The reported operating cash outflow exceeded the ₹25.84 crore accounting net loss for the same period.
Profit and cash flow differ because accounting includes non-cash items, and cash also moves as assets and liabilities change. MSEI’s operating-cash reconciliation includes substantial movements in financial and other assets. The abbreviated results do not explain those movements in enough detail to treat the entire outflow as a recurring annual cash-burn rate.
FY26 cash movement | ₹ crore |
Opening cash and cash equivalents | 47.50 |
Net cash used in operating activities | (149.01) |
Net cash used in investing activities | (881.79) |
Net cash generated from financing activities | 996.02 |
Closing cash and cash equivalents | 12.72 |
Source: MSEI’s FY26 audited consolidated cash-flow statement. Brackets represent outflows. Financing cash flow is not operating income.
The investing outflow should not all be labelled infrastructure spending. The statement separately reports ₹153 crore of purchase payments for property, plant, equipment and related capital and intangible development. It also records substantial transactions in investments and deposits.
Nor does the closing cash balance capture every financial resource. At 31 March 2026, the balance sheet separately showed current investments of ₹345.96 crore, non-current investments of ₹400.01 crore and non-current bank balances of ₹149.83 crore. Their classification and any restrictions matter: they cannot all be assumed to be immediately available cash.
Source: MSEI’s FY26 balance sheet and cash-flow statement.
Q1 FY27 update: the following quarter’s loss widened
For the quarter ended 30 June 2026, MSEI reported a consolidated net loss of ₹24.71 crore, compared with ₹7.43 crore in the corresponding quarter a year earlier. Operating revenue declined while expenses rose faster than total income.
These are unaudited consolidated quarterly results, subject to a limited review. The board approved them on 29 July 2026, and the auditor issued an unmodified limited-review conclusion. A limited review provides less assurance than an audit.
Particulars, ₹ crore | Q1 FY26: June 2025 | Q1 FY27: June 2026 |
Revenue from operations | 0.95 | 0.65 |
Other income | 5.50 | 19.65 |
Total income | 6.45 | 20.30 |
Total expenses | 13.88 | 45.01 |
Net loss | (7.43) | (24.71) |
Source: MSEI, unaudited consolidated financial results for the quarter ended 30 June 2026, dated 29 July 2026, subject to limited review. Original company document supplied for review; public-link access unavailable on 16 October 2026. Brackets indicate losses; each column covers one quarter.
Other income contributed approximately 96.8% of quarterly total income. The expense statement also separately records ₹6.76 crore for the liquidity enhancement incentive scheme. That is an expense recognised in this quarter; it should not automatically be described as a capital asset or evidence that the scheme has generated profitable activity.
The quarterly comparison prevents the FY26 loss reduction from being mistaken for a continuing improvement after year end. It does not establish the eventual outcome of MSEI’s expansion efforts or justify multiplying one quarter’s loss into a full-year forecast.
Source: MSEI’s June 2026 consolidated results, dated 29 July 2026, supplied original as described in Sources; income-share calculation by Unlisted Valley.
What shareholders should assess in the next results
The next financial test is whether operating revenue can grow enough to absorb the larger expense base. Higher other income can support the overall result, but it cannot by itself establish stronger demand for the exchange’s services.
Future financial disclosures can also clarify the composition and availability of financial assets and the reasons for operating-cash movements. That detail would help shareholders assess capital use without relying on the closing cash balance or accounting loss alone.
For company background, the current indicative quote and transaction information, see Unlisted Valley’s MSEI unlisted-share page.
Frequently asked questions
Is ₹59.07 crore MSEI’s FY26 operating revenue?
No. ₹59.07 crore is MSEI’s FY26 consolidated total income, including other income. Revenue from operations was ₹3.38 crore. Source: FY26 audited results.
Was the entire ₹1,238 crore raised during FY26?
No. MSEI’s ₹238 crore January 2025 placement fell in FY25; its ₹1,000 crore August 2025 placement fell in FY26. The combined figure spans two financial years. Source: placement disclosures in the FY26 results.
Does MSEI’s lower loss per share mean the business became profitable?
No. Basic and diluted earnings per share remained negative at (₹0.02) per share in FY26. Per-share figures also need to be read alongside the larger share base following the capital issue. Source: FY26 audited results.
Sources
- MSEI audited consolidated financial results, year ended 31 March 2026, dated 15 May 2026. Signed company results statement, accessed through a third-party mirror hosted by City Gold Credit Capital Limited. This is a results statement, not the full annual report.
- MSEI unaudited consolidated financial results, quarter ended 30 June 2026, dated 29 July 2026, subject to independent limited review. The original company document,
Published_FS_Consolidated_June_2026.pdf, was supplied for review. Its public link could not be accessed on 16 October 2026.
Financial figures are converted from ₹ lakh to ₹ crore except per-share figures. Growth rates, income shares and reconciliations are Unlisted Valley calculations from these statements, using displayed figures and rounded results. Annual figures are audited; the June quarter is unaudited and limited-reviewed.
Disclosure
Unlisted Valley facilitates buying and selling unlisted shares, including MSEI, and has a commercial interest in these transactions. This article provides financial information and analysis for educational purposes; it is not investment advice or a recommendation to buy or sell shares.
Capital raised, historical results and exchange initiatives do not guarantee future profitability, liquidity, listing or investment returns. Investors should independently assess the company’s financial position, valuation and risks.