Garuda Aerospace Financials FY26: Revenue, Profit and Cash Flow Analysis
Published: 11 min read

Garuda Aerospace's FY26 financials show higher revenue and profit alongside a larger operating cash outflow. Revenue from operations rose 66.8% to ₹205.96 crore, and profit after tax increased 41.1% to ₹25.92 crore. Yet operating activities used ₹41.55 crore of cash, while net trade receivables reached ₹234.40 crore at 31 March 2026.
For investors, the main question is how quickly those customer dues turn into cash. Profit growth is a positive development; the accounts also show that financing and payment collection remain important to sustaining the business.
Source: Garuda Aerospace Annual Report 2025–26, audited standalone accounts. Financial information through 31 March 2026; subsequent-development check dated 11 October 2026.
Key findings
- Services contributed just over half of operating revenue, but the accounts do not establish that this entire line is recurring Drone-as-a-Service income.
- Net profit grew more slowly than revenue, reducing the net profit margin.
- Operating cash flow was negative in both FY25 and FY26. Receivables were the largest negative working-capital movement in FY26.
- The receivables ageing schedule places the reported gross balance in overdue buckets. Overdue invoices and amounts that cannot be recovered are different categories.
How to read Garuda Aerospace's FY26 accounts
Garuda Aerospace operates in drone manufacturing and services, with applications including crop monitoring, mapping and aerial work. Its audited accounts identify one reportable segment: Drone Manufacturing and Drone as a Service. They do not provide separate profit figures for agriculture, defence or training.
FY26 was its first annual reporting year under Indian Accounting Standards, or Ind AS. The FY25 comparison below comes from the same FY26 report, which also presents FY25 on that basis. This avoids mixing the latest results with an older accounting presentation.
The report uses ₹ million. Tables here convert those figures into ₹ crore; EPS remains rupees per share. Percentage changes use the original figures before rounding.
There is an unresolved revenue discrepancy within the report: the Board's narrative says revenue exceeded ₹250 crore, while the audited statements show ₹205.96 crore of operating revenue and ₹206.22 crore of total income. This analysis uses the audited statement figures. The narrative does not supply a reconciliation.
Source: Annual Report 2025–26, Board report, auditor's report and segment disclosure.
Garuda Aerospace FY26 revenue, profit and EPS
Metric | FY26 | FY25 |
Revenue from operations, ₹ crore | 205.96 | 123.46 |
Other income, ₹ crore | 0.27 | 1.35 |
Total income, ₹ crore | 206.22 | 124.81 |
Profit before tax, ₹ crore | 34.06 | 25.41 |
Profit after tax, ₹ crore | 25.92 | 18.37 |
Net profit margin on operating revenue | 12.58% | 14.88% |
Basic and diluted EPS, ₹ | 4.99 | 3.67 |
Source: Annual Report 2025–26, audited standalone profit-and-loss statement and EPS note. Net profit margins are Unlisted Valley calculations: PAT divided by revenue from operations.
Revenue grew faster than profit, and the net profit margin fell by about 2.3 percentage points. One material expense was the ₹11.13 crore impairment charge on financial assets, including ₹11.11 crore relating to trade receivables. The impairment charge is an expense for expected credit losses, reducing profit without an immediate cash payment. For receivables, the loss allowance is the separate balance-sheet deduction from amounts owed by customers.
The published EPS comparison incorporates the report's bonus and stock-split adjustments. Older, unadjusted per-share figures should not be compared directly with ₹4.99. The EPS denominator is a weighted average for the reporting period, rather than a current outstanding-share count.
Where the revenue growth came from
Operating-revenue component, ₹ crore | FY26 | FY25 |
Sale of drones and drone parts | 99.36 | 59.71 |
Sale of services | 106.46 | 57.83 |
Delivery charges | 0.13 | 0.14 |
Production Linked Incentive income | 0 | 5.78 |
Total revenue from operations | 205.96 | 123.46 |
Source: Annual Report 2025–26, revenue note; audited standalone FY26 and FY25. Totals use original figures; rounded components may differ slightly.
Service sales increased 84.1%, compared with 66.4% growth in drone and parts sales. Services accounted for 51.7% of FY26 operating revenue, up from 46.8% in FY25.
That establishes a larger service contribution. It does not establish service margins, renewal rates or a predictable subscription stream. The audited label is “sale of services”; assigning the whole amount to one specific service offering would go beyond that disclosure.
The FY25 revenue note also explains an important numerical difference. Customer-contract revenue was ₹117.68 crore, while total operating revenue was ₹123.46 crore. The ₹5.78 crore difference matches the disclosed Production Linked Incentive income. No PLI income was recorded in FY26. These labels should stay separate when comparing figures from different sources.
The customer disclosure shows the largest customer's share falling from 13.31% to 7.77%. The FY25 figure of 38.29% refers to the combined contribution of customers individually accounting for at least 10% of customer revenue; it is not the largest customer's share.
FY26's standalone geographical disclosure records the customer revenue in India and no outside-India revenue. International partnerships or expansion plans therefore should not be treated as an established FY26 export earnings contribution.
Why higher profit did not produce operating cash
Garuda Aerospace reported ₹25.92 crore of FY26 profit after tax but a ₹41.55 crore operating cash outflow. The cash-flow statement shows how working capital absorbed cash as the business expanded.
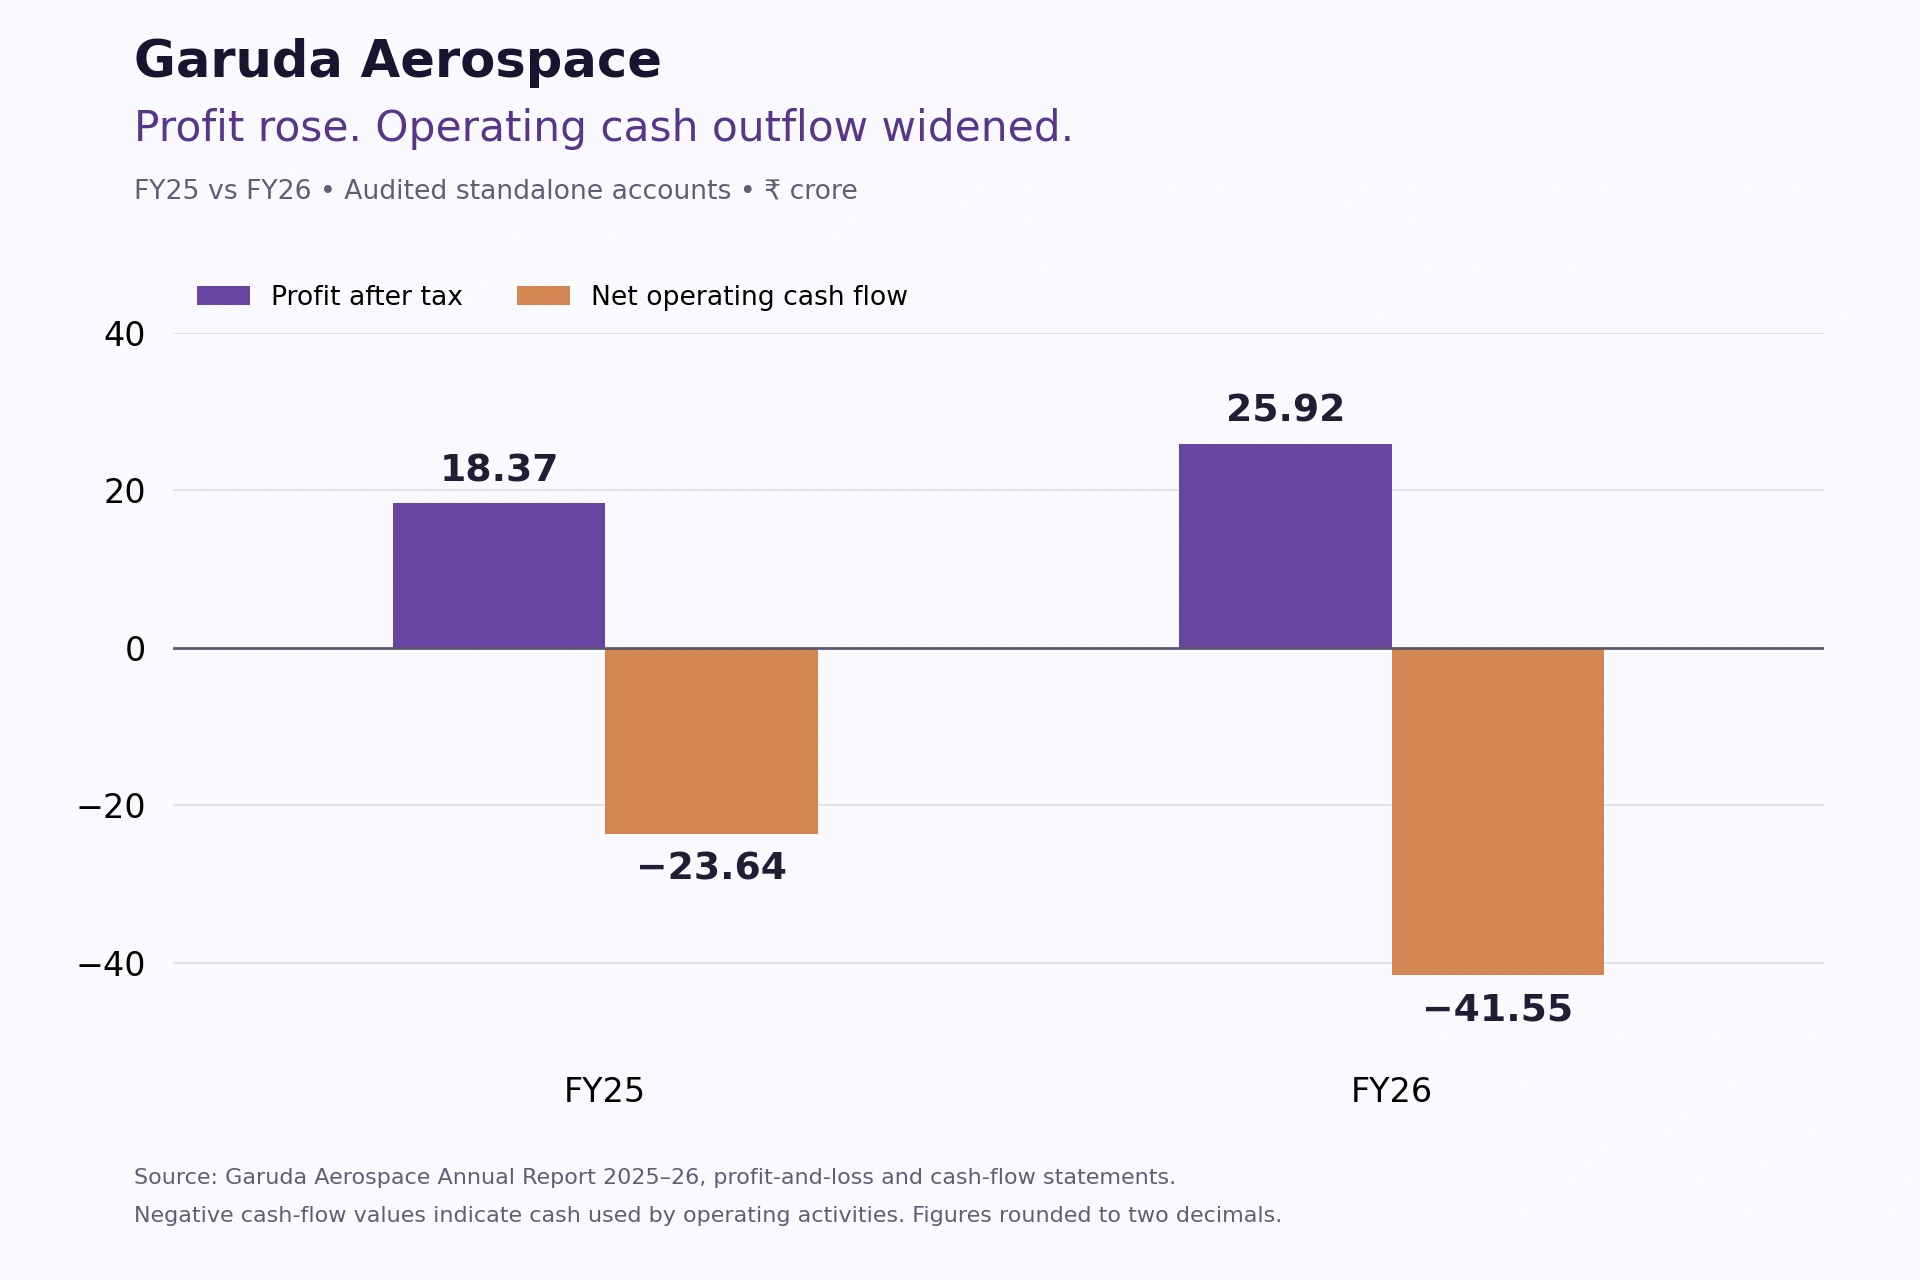
Profit after tax increased while operating cash outflow widened. Audited standalone FY25 and FY26; ₹ crore. Source: Garuda Aerospace Annual Report 2025–26.
Cash-flow measure, ₹ crore | FY26 | FY25 |
Operating cash before working-capital movements | 50.34 | 30.23 |
Net cash from operating activities | −41.55 | −23.64 |
Net cash from investing activities | −19.46 | −15.93 |
Net cash from financing activities | 51.46 | 30.72 |
Source: Annual Report 2025–26, audited standalone cash-flow statement. Negative values indicate cash outflows.
Before working-capital changes, operating cash was positive. The FY26 statement then records a ₹133.56 crore negative movement in trade receivables and ₹9.68 crore absorbed by inventories. A ₹38.73 crore increase in trade payables provided a partial offset. Other working-capital changes and ₹6.62 crore of taxes paid also affected the final operating cash figure.
The ₹133.56 crore figure is a cash-flow adjustment, while net receivables on the balance sheet increased by ₹122.45 crore. The difference approximately equals the ₹11.11 crore receivables impairment charge, which reduces net receivables without bringing in cash. The figures reconcile within the report’s rounding.
Trade receivables are amounts customers owe for recognised sales. Revenue and profit can be recorded before payment arrives, while the company still needs cash to pay suppliers, staff and other costs. The receivables movement was the largest negative working-capital item in Garuda's FY26 statement.
Across FY25 and FY26, net operating cash outflow totalled ₹65.19 crore. The useful test in subsequent results is whether higher sales are accompanied by better collections and operating cash generation.
What the receivables ageing and impairment show
Net trade receivables increased 109.4% to ₹234.40 crore, faster than operating revenue. The closing balance was about 114% of FY26 annual operating revenue. This compares a year-end balance with a full year's sales; it does not measure the actual time each customer took to pay.
The gross balance before loss allowance was ₹243.28 crore. The report's ageing schedule shows the following distribution from the payment due date:
Gross trade receivables at 31 March 2026 | ₹ crore |
Not due | 0 |
Less than six months overdue | 155.99 |
Six months to one year overdue | 39.63 |
One to two years overdue | 40.96 |
Two to three years overdue | 6.70 |
More than three years overdue | 0 |
Total gross receivables | 243.28 |
Less: closing loss allowance | 8.88 |
Net receivables | 234.40 |
Source: Annual Report 2025–26, trade-receivables note and ageing schedule; audited standalone balance at 31 March 2026. Rounded age buckets may not sum exactly to the displayed total.
About ₹47.66 crore, or 19.6% of the gross balance, was more than one year overdue. The schedule shows no amount in the “not due” column. That makes subsequent collection evidence important, but it does not establish that every overdue invoice will become a loss.
Three impairment figures answer different questions. The ₹11.11 crore receivables impairment remeasurement is the year's charge; ₹8.88 crore is the closing loss allowance; and ₹5.11 crore was written off against the allowance during the year. The allowance movement starts at ₹2.88 crore, adds the remeasurement and subtracts write-offs to arrive at the closing balance. Those amounts should not be combined as though each were a separate additional loss.
The detailed receivables table and ageing table also differ in how they classify a small credit-impaired amount, although their gross and net totals reconcile. The totals and overdue periods are usable; the tables do not support a blanket claim that every balance is either sound or unrecoverable. The report also does not establish how much of this year-end balance has been collected since March.
Liquidity and how the business was financed
Balance-sheet measure, ₹ crore | 31 March 2026 | 31 March 2025 |
Net trade receivables | 234.40 | 111.95 |
Inventories | 34.27 | 24.59 |
Bank cash and cash equivalents | 2.39 | 0.95 |
Other current bank balances | 2.80 | 3.43 |
Borrowings, current and non-current | 22.27 | 6.71 |
Trade payables | 64.55 | 25.82 |
Total equity | 239.84 | 165.59 |
Source: Annual Report 2025–26, audited standalone balance sheet and bank/borrowing notes. Borrowings include the disclosed bank overdrafts; lease liabilities are separate.
The ₹2.39 crore bank-cash figure and the negative ₹8.59 crore closing total in the cash-flow statement describe different presentations. The latter deducts a ₹10.98 crore ICICI overdraft from bank cash. It does not mean the company had a negative amount of cash in every bank account. Other bank balances and deposits are disclosed separately, with much of the other current bank balance held as margin money.
FY26 lease liabilities were a further ₹7.61 crore, separate from borrowings. Total equity is an accounting capital measure, so ₹239.84 crore of equity should not be read as cash available to meet immediate payments.
The financing statement records gross FY26 inflows of ₹17.74 crore from equity and preference shares, ₹31.47 crore from debentures and ₹10.83 crore from unsecured borrowings. After financing outflows, net financing cash was ₹51.46 crore. This helped support operating and investing outflows totalling about ₹61.00 crore.
These figures show why access to funding mattered during the year. They do not provide a current cash balance or establish how long the company can fund future spending.
Auditor findings and capital deployment to monitor
The auditor's emphasis of matter concerns the transition to Ind AS and expressly leaves the audit opinion unmodified. The audit also records no loan or interest repayment default during FY26. Those dated findings should be read alongside the cash-flow concerns.
The statutory-dues annexure identifies ₹3.19 crore of advance tax relating to June and September 2025 instalments as not yet paid. That is a finding in the audit signed on 17 August 2026; subsequent payment status has not been established here.
The related-party note reports ₹12.93 crore of capital advances to Agni Estates and Foundations Private Limited at 31 March 2026, up from ₹6.49 crore a year earlier, plus ₹1.13 crore of other advances. The report identifies this as an entity over which key management personnel or their relatives exercise significant influence. The balances warrant monitoring for deployment and recovery, without implying that the relationship itself establishes wrongdoing.
Outsourced contract cost also increased to ₹51.87 crore from ₹21.78 crore. It is already included within the disclosed cost of materials consumed and should not be added again to expenses. The note provides useful operating context, but does not quantify the proportion of every activity performed by outside suppliers.
Source: Annual Report 2025–26, auditor's report, statutory-dues annexure, related-party and material-cost notes.
What investors should check after FY26
On 7 October 2026, ETtech reported approximately $10 million of pre-IPO funding at a $320 million pre-money valuation. That event falls after the FY26 balance-sheet date. The reported funding headline cannot show whether March receivables were collected, how the proceeds were used or what cash is available now. The Garuda funding news covers the event separately.
Area | Useful evidence in the next financial update |
Customer collection | Movement in overdue age buckets, write-offs and disclosed subsequent recoveries |
Operating cash | Whether operating cash flow improves alongside revenue and profit |
Impairment | New charges, allowance coverage and the reasons given for changes |
Liquidity | Bank cash, overdrafts, other deposits and near-term liabilities considered together |
Capital deployment | Use or recovery of related-party advances and the effect of new funding |
Monitoring framework: Unlisted Valley analysis based on the FY26 disclosures. These are evidence to watch, not forecasts or company targets.
For filing and timetable questions, read the Garuda Aerospace IPO status analysis. Current indicative share information belongs on the Garuda Aerospace unlisted-share page.
Sources
- Garuda Aerospace Annual Report 2025–26: audited standalone financial statements signed 17 August 2026, financial notes, Board report and auditor's annexures.
- ETtech: Garuda Aerospace lands $10 million pre-IPO funding, 7 October 2026: accessible reporting used only for the subsequent funding context.
Disclosure
This article provides general information and financial analysis, not personalised investment advice or a buy/sell recommendation. Unlisted shares involve valuation, liquidity and exit risks. Unlisted Valley facilitates transactions in unlisted shares. FY26 financial figures are historical, and subsequent funding or IPO developments do not guarantee future performance or returns.