API Holdings (PharmEasy) FY26 Financial Results: Revenue, Losses and Cash Flow
Published: 9 min read

API Holdings, the group behind the PharmEasy brand, reported ₹6,618.50 crore in revenue from operations and a ₹520.29 crore consolidated net loss in FY26. Revenue grew 12.7%, the loss narrowed by 66.9%, and operating cash flow turned positive at ₹77.18 crore.
These are API Holdings’ consolidated results for the year ended 31 March 2026, compared with FY25. They cover the group’s pharmacy distribution, diagnostics and other consolidated activities, rather than just sales through the PharmEasy app.
Source: API Holdings FY2025–26 annual report, consolidated financial statements. Percentage changes calculated from the audited figures.
What changed in FY26?
- Revenue increased while the group’s total expenses before exceptional items fell slightly.
- Lower share-based employee expenses and the absence of FY25 exceptional charges helped reduce the net loss.
- Operating cash flow turned positive, with cash interest payments reported separately under financing activities.
- Cash also came from fixed-deposit withdrawals and transactions involving subsidiary shareholders, separate from operating cash generation.
API Holdings FY26 results compared with FY25
Amounts are in ₹ crore, except earnings per share. Negative figures indicate losses or cash outflows.
Metric | FY25 | FY26 |
Revenue from operations | 5,872.16 | 6,618.50 |
Total income, including other income | 5,980.03 | 6,689.29 |
EBITDA before exceptional items and ESOP expense* | −179.10 | 99.90 |
Finance costs | 506.11 | 409.96 |
Employee share-based payment expense | 482.25 | 61.97 |
Exceptional charges | 296.51 | 0 |
Loss after tax | −1,572.39 | −520.29 |
Net cash from operating activities | −210.92 | 77.18 |
Basic earnings per share, ₹ | −1.05 | −0.37 |
Source: API Holdings FY2025–26 annual report, Directors’ Report and audited consolidated profit-and-loss and cash-flow statements. Figures converted from ₹ million to ₹ crore. *The EBITDA row uses the company’s rounded presentation; other income is outside this adjusted operating measure. ESOP means employee stock option plan; the excluded expense is the employee share-based payment charge.
The relationship between revenue and costs improved: operating revenue rose by ₹746.34 crore, while total expenses before exceptional items declined from ₹7,208.56 crore to ₹7,146.74 crore. However, part of that expense improvement came from a lower non-cash share-based payment charge.
Why did revenue increase?
Management attributes the 12.7% growth to a better customer and business mix, improved service levels and greater use of existing infrastructure. Its annual commentary describes an increased focus on higher-margin customers, better fulfilment and more business from existing customers.
The growth was uneven. Sales to chemists and institutions increased, while hospital sales declined as the group moved away from customers with lower margins and higher working-capital requirements. Management also described stronger diagnostics performance and a wider Thyrocare test menu and franchise network.
That mix matters in a distribution business. Additional sales can consume cash through inventory and customer credit; growth is more useful when the margin and collection profile improve alongside it.
Source: Annual report — management commentary on FY26 results. Business drivers are management’s explanation; the working-capital implication is our interpretation.
Why did the net loss fall so sharply?
The reduction came from several sources, including operating improvement, lower financing costs and changes in accounting charges.
Employee benefit expense fell from ₹908.40 crore to ₹476.87 crore. Of that ₹431.53 crore decline, approximately ₹420.28 crore came from lower employee share-based payment expense. The reduction therefore should not be read as an equivalent fall in cash payroll costs.
Expected credit-loss expense also declined, from ₹100.13 crore to ₹18.52 crore. This is the accounting charge for expected losses on financial assets, including customer receivables. Finance costs fell by ₹96.15 crore.
Finally, FY25 included ₹296.51 crore of exceptional charges, including impairments and losses on investment disposals. The consolidated accounts reported no exceptional charge in FY26. That change helps explain the year-on-year reduction, but its absence does not create the same recurring saving in each future year.
Source: Audited consolidated accounts, profit-and-loss statement, cash-flow statement and exceptional-items note. Differences calculated from the reported figures.
Did positive EBITDA mean API Holdings became profitable?
API Holdings remained loss-making on a consolidated net basis in FY26. The ₹99.90 crore positive figure is EBITDA before exceptional items and ESOP expense, a measure that excludes several costs included in the final result.
EBITDA means earnings before interest, tax, depreciation and amortisation. Under the company’s presentation, the adjusted measure also excludes employee share-based payment expense and other income. Finance costs alone were ₹409.96 crore, and depreciation and amortisation added ₹156.26 crore of expense.
The reported group loss after tax was ₹520.29 crore. The loss attributable specifically to API Holdings’ owners was higher, at ₹569.97 crore, because outside shareholders in subsidiaries, called non-controlling shareholders, had a ₹49.68 crore share of profit. These figures describe different levels of the same consolidated result.
The standalone company’s ₹572.75 crore profit after tax included a ₹784.96 crore net exceptional gain. Before exceptional items and tax, it had a ₹212.21 crore loss. Standalone accounts cover the parent legal entity; consolidated accounts bring together the group and eliminate relevant intra-group balances and transactions. The standalone profit therefore does not establish that the group earned a net profit.
Source: Annual report — consolidated and standalone profit-and-loss statements, standalone exceptional-items note and consolidation policies.
What does the FY26 cash flow show?
Operating cash flow improved from a ₹210.92 crore outflow in FY25 to a ₹77.18 crore inflow in FY26. The annual cash-flow statement separates this from investment movements and financing transactions.
Cash-flow category, ₹ crore | FY25 | FY26 |
Operating activities | −210.92 | 77.18 |
Investing activities | 795.41 | 514.93 |
Financing activities | −792.97 | −465.74 |
Net cash flow during the year | −208.48 | 126.37 |
Source: Audited consolidated cash-flow statement, FY2025–26 annual report. Rounded figures may not sum exactly.
How the operating cash inflow was generated
After adjusting the pre-tax loss for non-cash items and items classified elsewhere in the cash-flow statement, operating profit before working-capital changes was ₹143.09 crore. Working-capital movements added approximately ₹14.91 crore, and net tax payments used ₹80.83 crore, leaving ₹77.18 crore of operating cash inflow.
Interest payments are important to this reading. The group classified ₹304.04 crore of cash interest on borrowings and ₹13.41 crore of lease interest within financing activities. The positive operating cash-flow figure is therefore before those cash interest payments.
Subtracting these two interest payments from operating cash flow gives an analytical shortfall of approximately ₹240.27 crore, before capital expenditure or debt-principal payments. This is a simple cash-coverage calculation, rather than a reported cash-flow subtotal. It shows why positive operating cash flow alone does not demonstrate that operations covered the year’s cash interest burden.
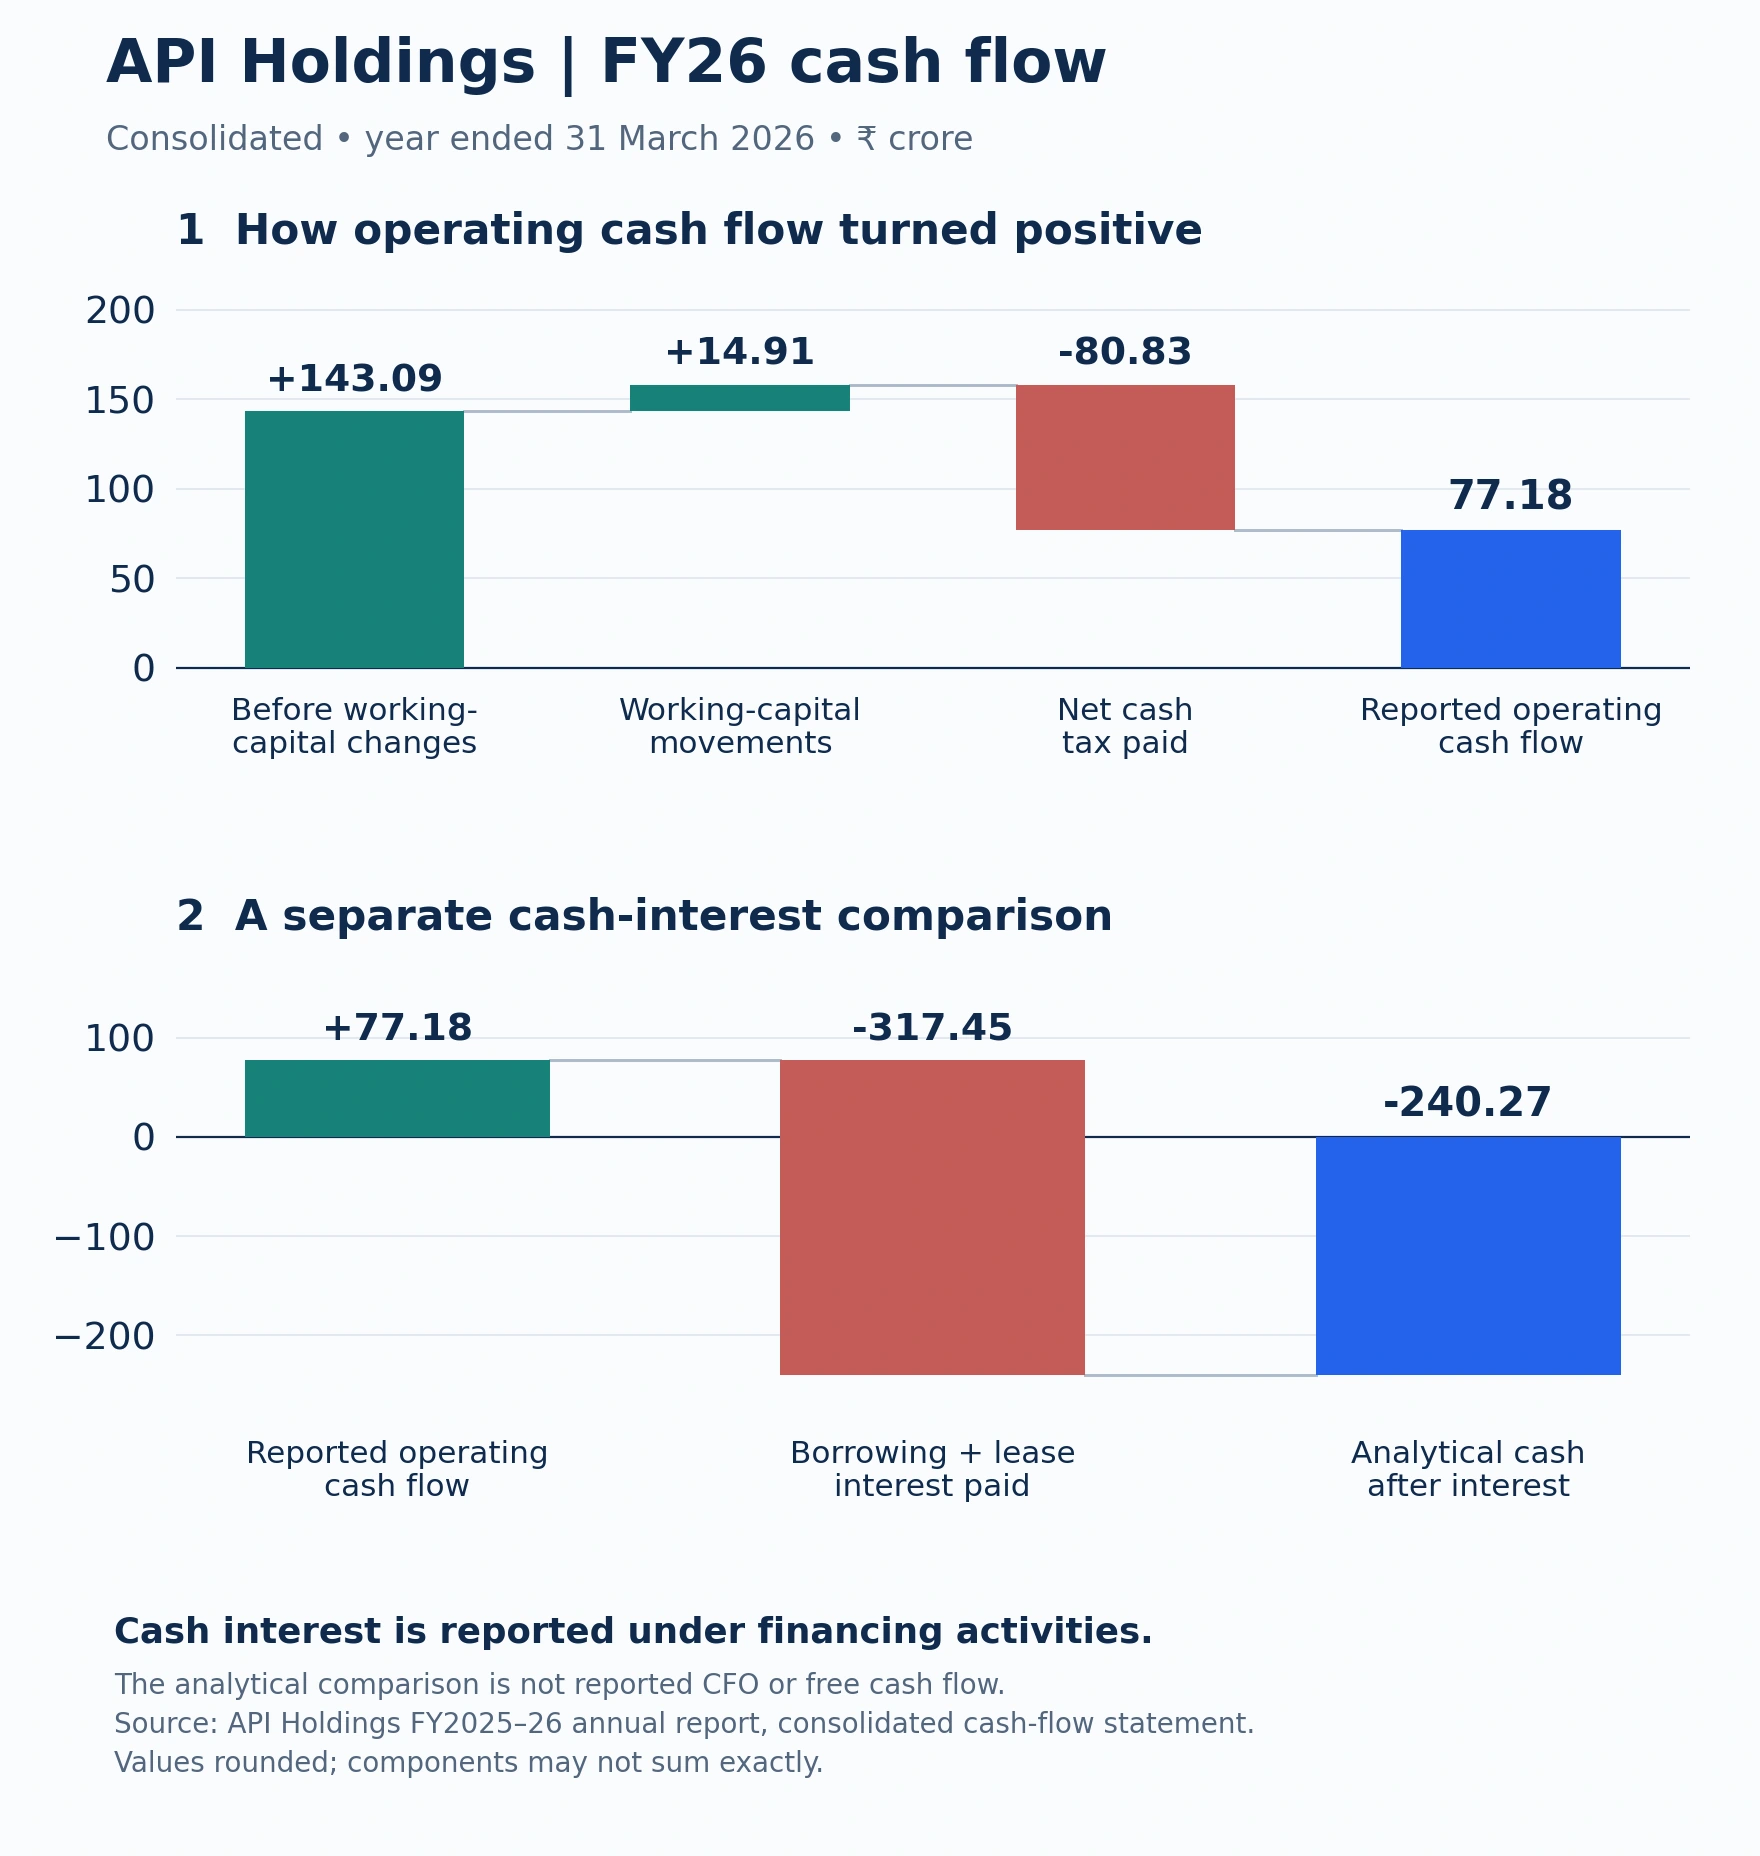
API Holdings consolidated FY26 cash flow, year ended 31 March 2026. Cash interest is classified under financing activities. The analytical comparison is not reported operating cash flow or free cash flow. Figures rounded. Source: API Holdings FY2025–26 annual report, consolidated cash-flow statement.
Cash-flow bridge, consolidated FY26 | ₹ crore |
Operating profit before working-capital changes | 143.091 |
Working-capital contribution (calculated) | 14.911 |
Net cash tax paid | −80.825 |
Reported net operating cash flow | 77.177 |
Cash interest on borrowings and leases, financing classification | −317.450 |
Analytical cash after interest (calculated) | −240.273 |
Source: API Holdings FY2025–26 annual report, consolidated cash-flow statement. Values retain three decimals to show the bridge; the visual rounds to two. The last row is an analytical comparison, not a reported subtotal.
Why investing cash flow was positive
Investing activities generated ₹514.93 crore of net inflow. A major component was ₹553.26 crore released from fixed deposits with original maturities exceeding three months.
Withdrawing a deposit releases money already held in another form. It increases available cash but does not represent revenue or cash earned from customers.
What financing activities added and used
The consolidated cash-flow statement recorded ₹638.25 crore of net inflow from transactions with non-controlling interests—outside shareholders in subsidiaries. The annual report describes FY26 ownership transactions including a partial sale of the Thyrocare stake and an additional stake purchase in AKP Healthcare. These transactions generated or used cash through changes in subsidiary ownership, separate from customer operations.
Financing activities also included ₹1,671.13 crore of non-current borrowing proceeds, net of processing fees, and ₹2,402.06 crore of non-current borrowing repayments. After interest, lease payments and the other financing movements, the net financing cash outflow was ₹465.74 crore. The ownership-related inflow helped fund the year’s cash needs even though the financing category as a whole showed an outflow.
Source: Audited consolidated cash-flow statement and note on transactions with non-controlling interests. Working-capital and cash-interest coverage calculations are derived from the cash-flow statement.
How should the later debt repayment be read?
At 31 March 2026, the consolidated balance sheet showed approximately ₹1,332.3 crore of current and non-current borrowings combined, excluding lease liabilities.
The Directors’ Report separately records the subsequent redemption of the remaining approximately ₹1,050 crore NCD facility. NCDs are non-convertible debentures, a form of borrowing. This repayment occurred after FY26 and should not be applied retrospectively to the March balance sheet or the year’s finance costs.
The report describes the company as debt-free on that facility. That wording should not be extended automatically to every group borrowing, lease liability or other obligation. Our PharmEasy IPO and Thyrocare merger news report provides the separate later-event context.
Source: Annual report — consolidated balance sheet and Directors’ Report on refinancing and debt reduction.
Which audit disclosures deserve attention?
The consolidated auditor gave an unmodified opinion in September 2026, concluding that the financial statements gave a true and fair view. Its emphasis-of-matter paragraphs drew attention to specific disclosures, including a forensic investigation into suspected historical employee fraud at subsidiary Ascent Wellness and Pharma Solutions.
Management’s internal estimate was ₹12.73 crore, with the relevant balances already provided for in earlier years. At the report date, the external investigation was still in progress, so the auditor said the accuracy of the internally estimated amount could not yet be determined. The report also highlighted that two subsidiaries’ accounts were prepared on a basis that did not assume they would continue operating. This concerned those subsidiaries; it was not a conclusion that the entire API group had ceased to be a going concern.
Source: Consolidated auditor’s report and annual-report notes on subsidiary going-concern assessments and the forensic investigation. Investigation status is as disclosed in the September 2026 report.
What should shareholders track after FY26?
The next useful comparison is whether revenue growth translates into stronger operating cash generation after accounting for the financing burden. Investors should also distinguish further underlying cost improvements from changes in share-based payment charges, provisions and exceptional items.
For share information and transaction enquiries, see our API Holdings (PharmEasy) unlisted-shares page. The annual results provide a financial baseline; they do not establish an IPO timetable or an assured shareholder exit.
Sources and methodology
- API Holdings FY2025–26 annual report: Directors’ Report; standalone and consolidated financial statements; relevant accounting and audit notes. Financial statements signed 7 September 2026.
- API Holdings official financial-reports page: source location for the annual report and investor presentations.
Financial comparisons use FY25 figures presented in the FY26 report. Amounts reported in ₹ million have been divided by 10 to express ₹ crore. The company’s adjusted EBITDA presentation is labelled separately from statutory net profit. Quarterly management-presentation figures are not combined with the annual statutory dataset.
Disclosure
Unlisted Valley facilitates transactions in unlisted shares and may have a commercial interest in companies covered. This article is for information and is not investment advice. Unlisted shares involve illiquidity and the risk of capital loss.